
Introduction to Reporting
BaseBuilders reporting is built around three steps: choosing the records to include, choosing the data fields to show, and deciding how that information is grouped and summarized. This article introduces those three steps and the tools you'll use to run and save reports.
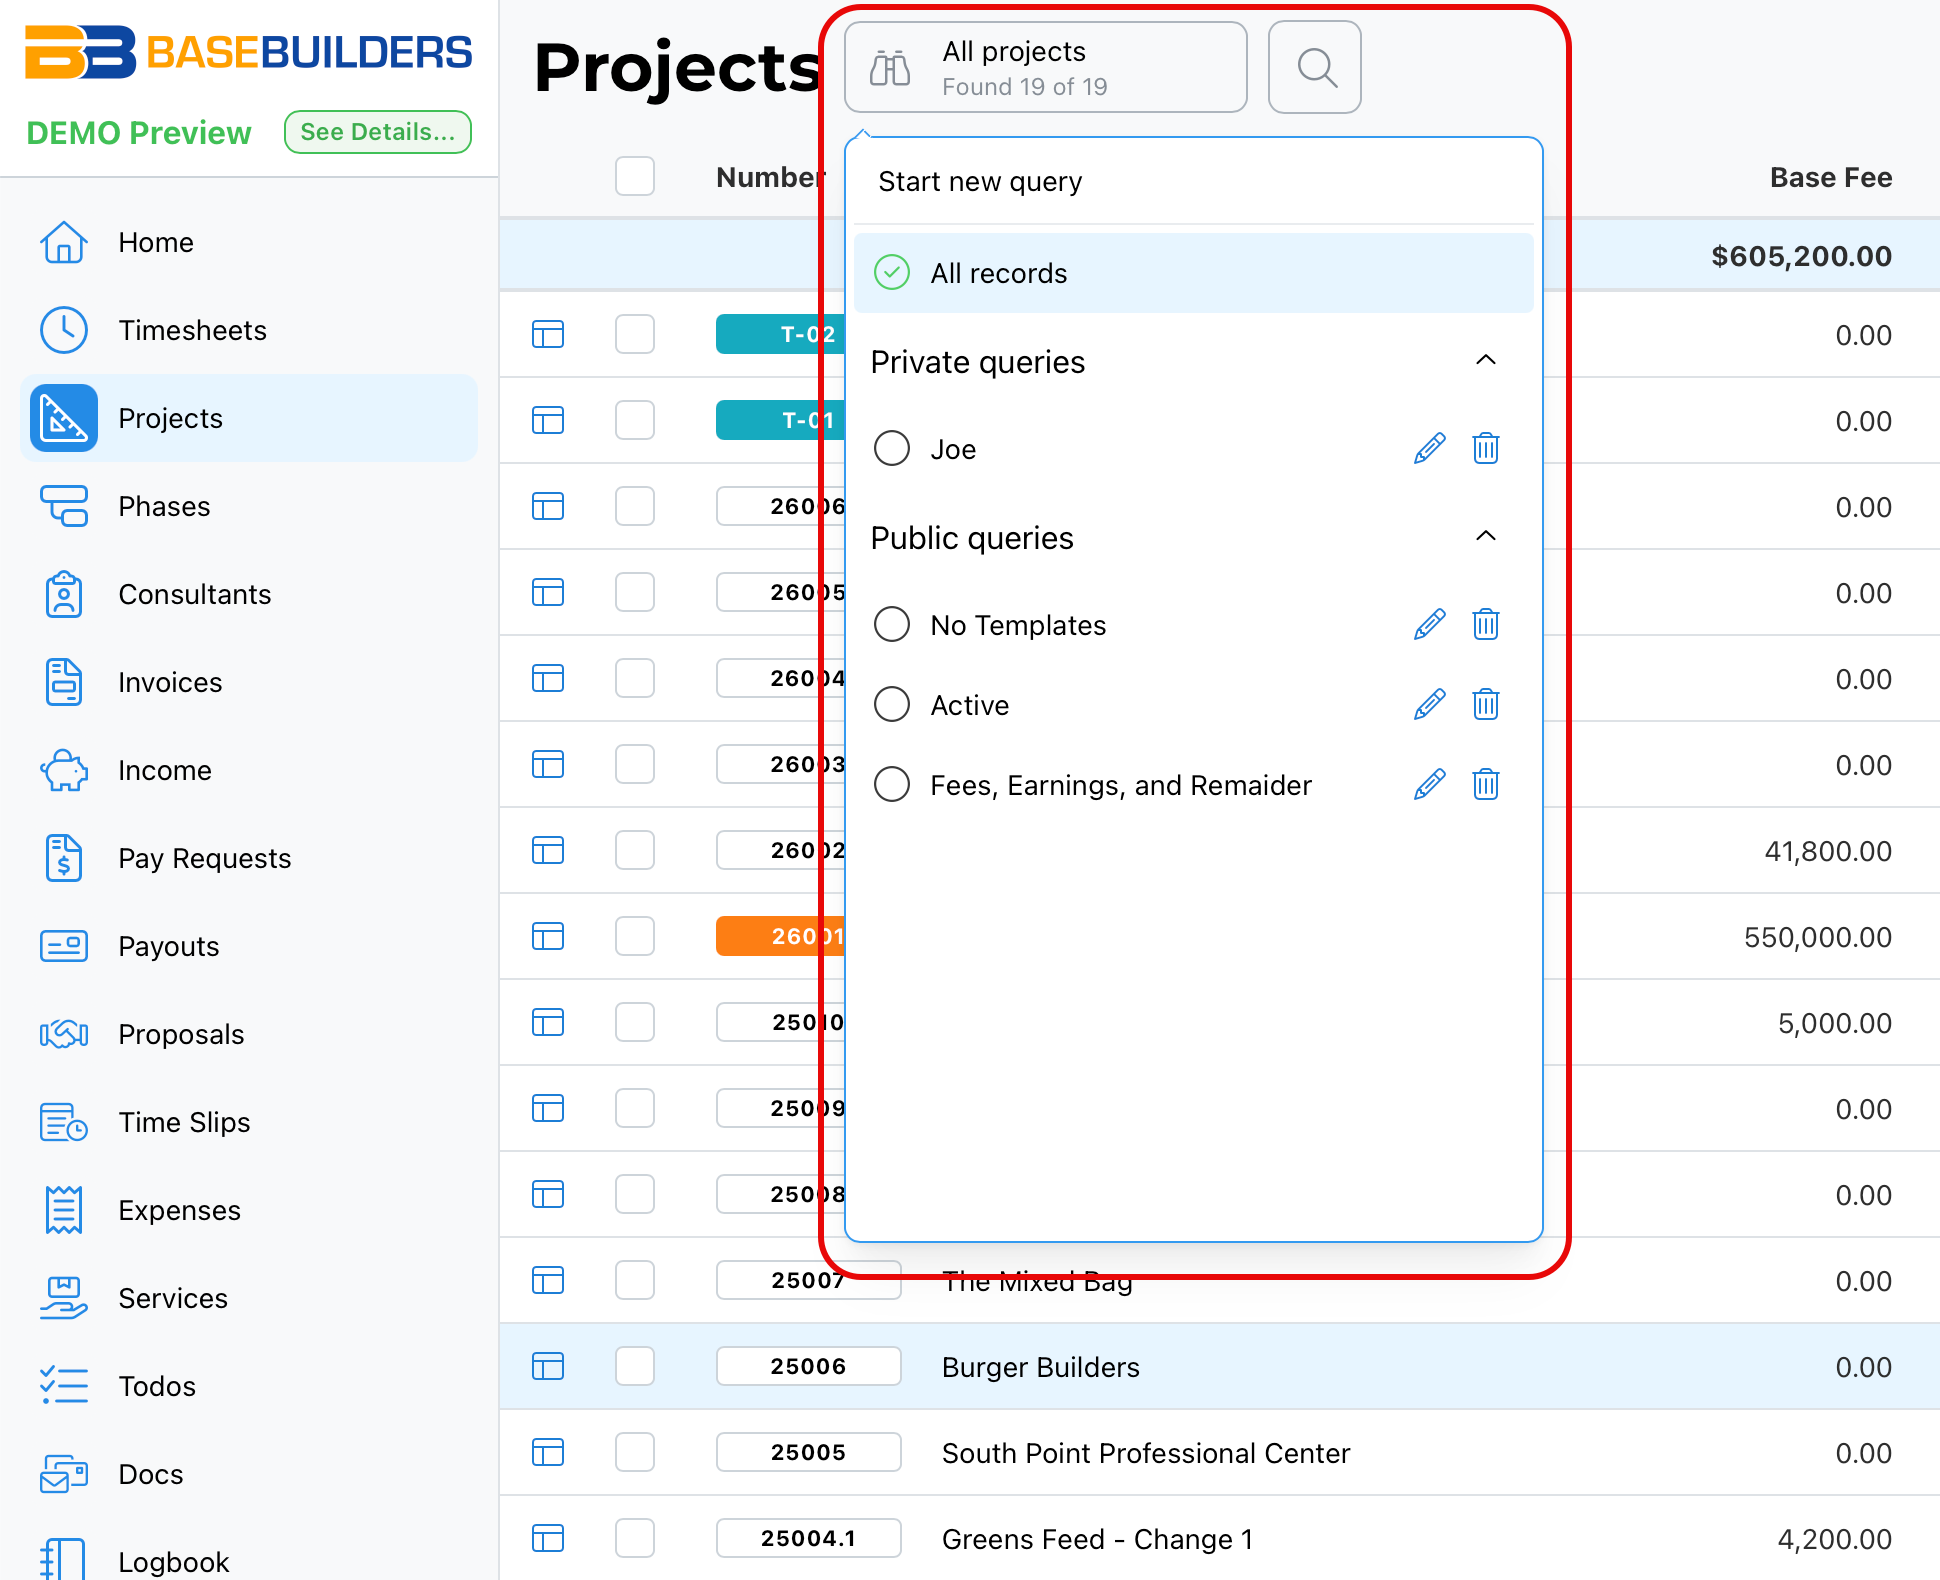
Step 1: Records
Every report starts with a module — Projects, Invoices, Payouts, Proposals, Time Slips, or whichever module holds the data you want to report on. From there, you run a query to determine which records are actually included in the report. See a related video on building queries for more detail on constructing one.
Step 2: Data Fields
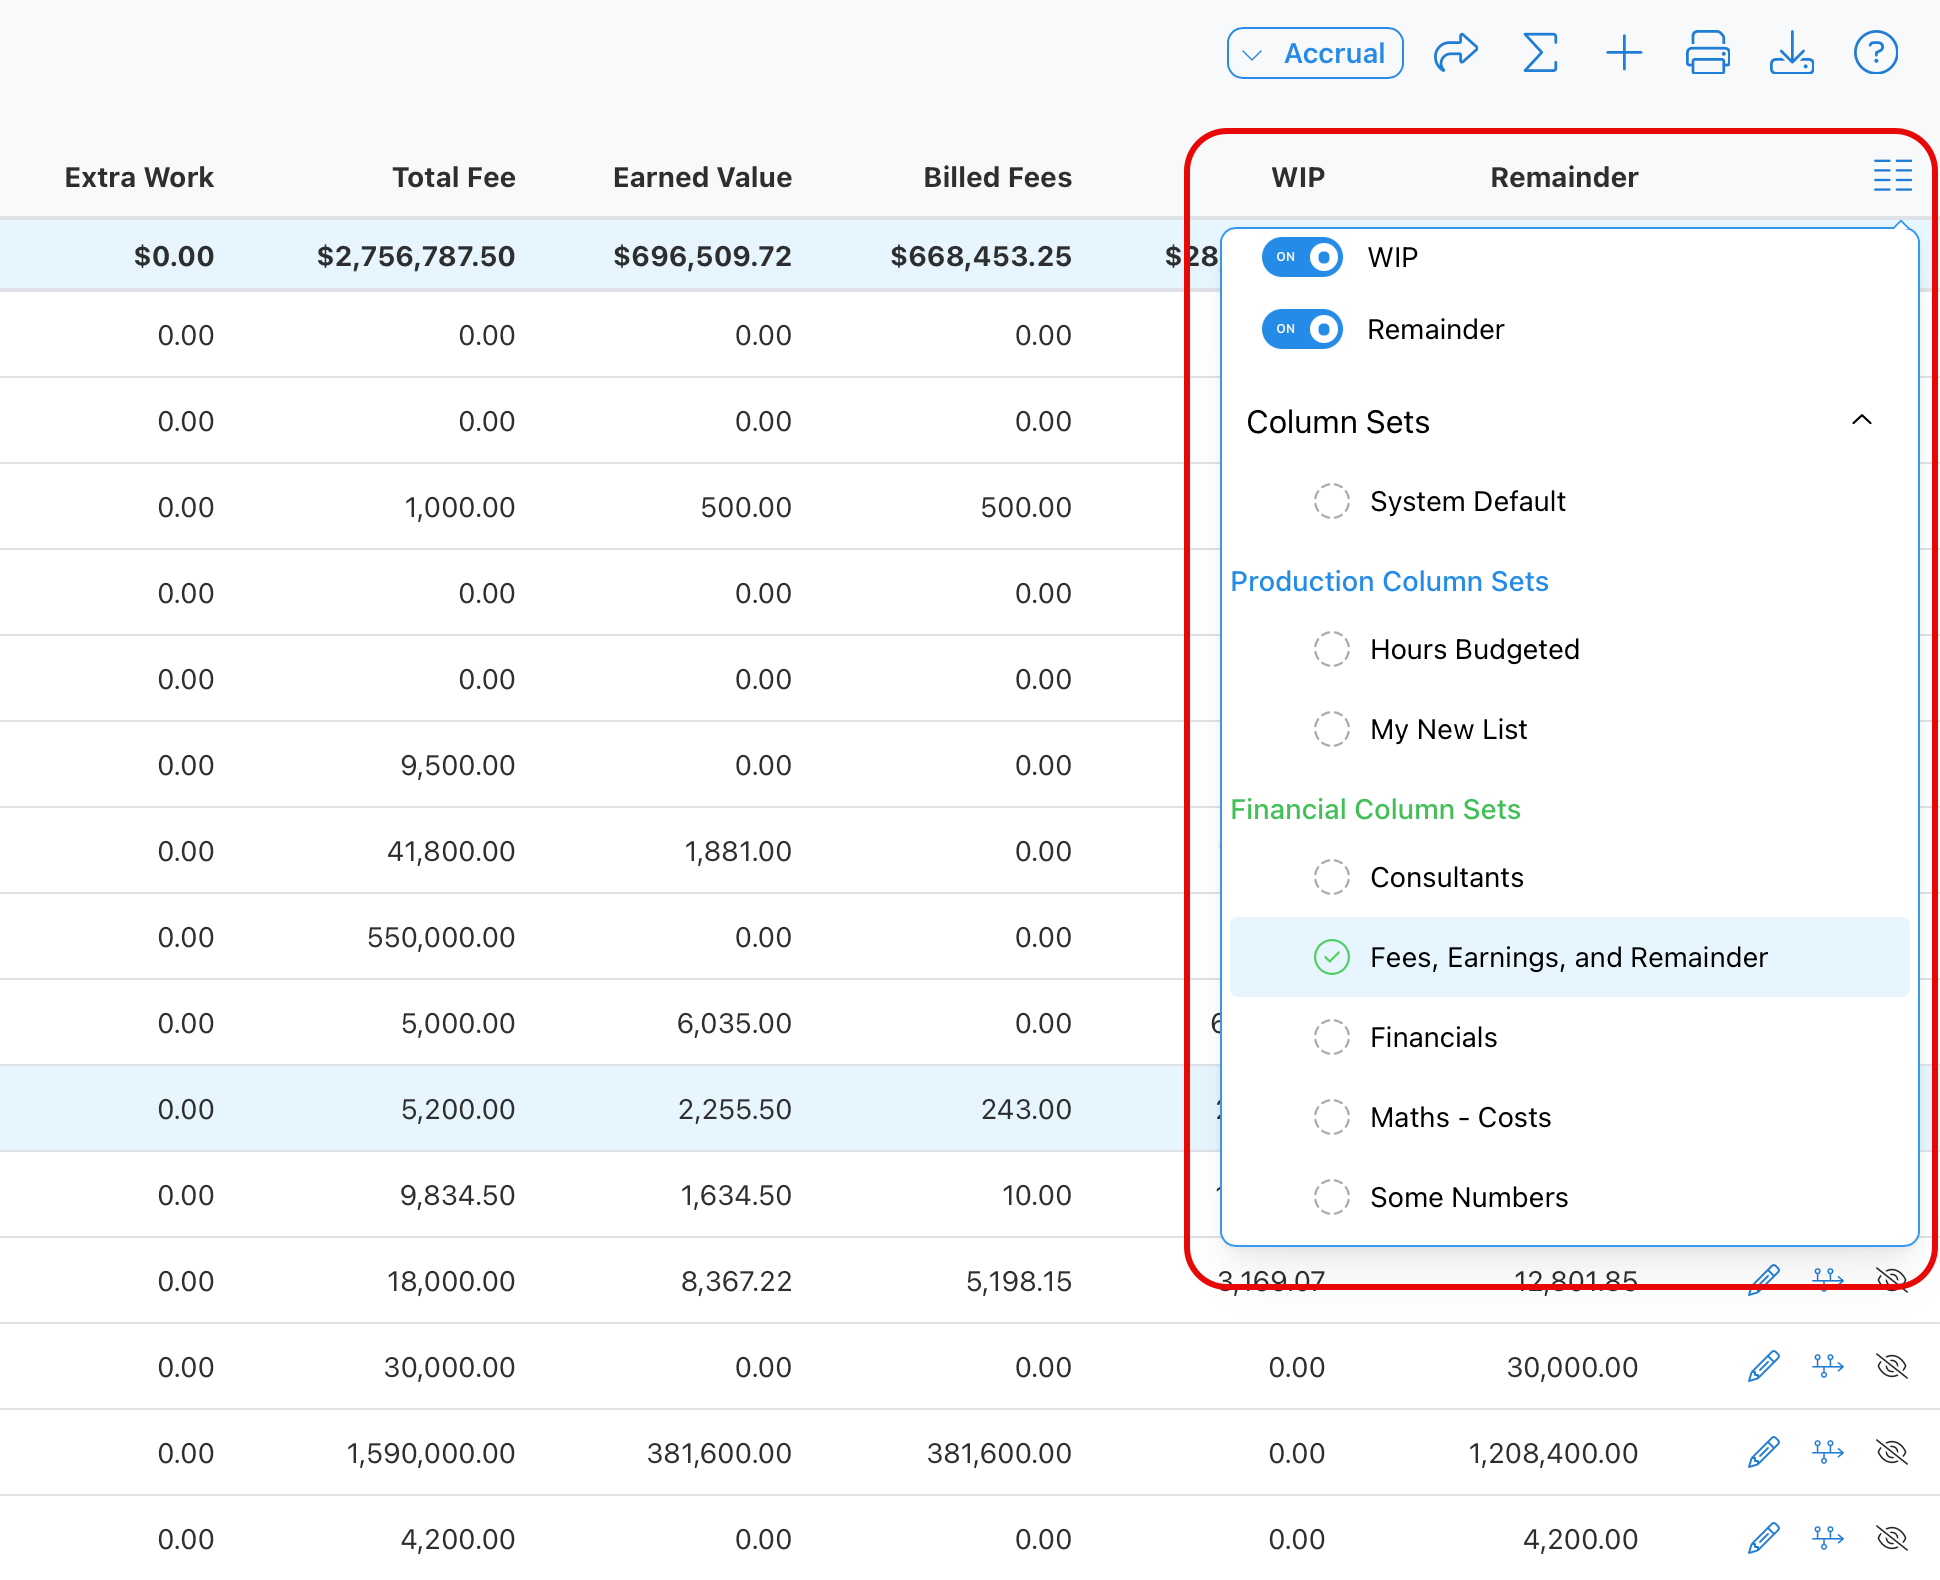
Once you know which records you're working with, decide what data you actually want to see. This uses the same column set concept found in list views — you select the specific fields to include. For a project report, that might mean hours remaining, backlog, fee, earned value, and billings. For a time slip report, it might mean staff, hours, dates, direct labor, overhead, billing value, and pay and billing rates.
See Column Sets for more on building and managing these.
Step 3: Summarization
Finally, decide how the report should be grouped and summarized:
- Primary sort field — the main grouping for the report (for example, Project).
- Secondary sort field (optional) — an additional grouping level (for example, Phase).
- Third-level sort field (optional) — a further grouping level, if needed.
- Itemized or Summarized — whether the report shows individual line-level detail or rolled-up totals.
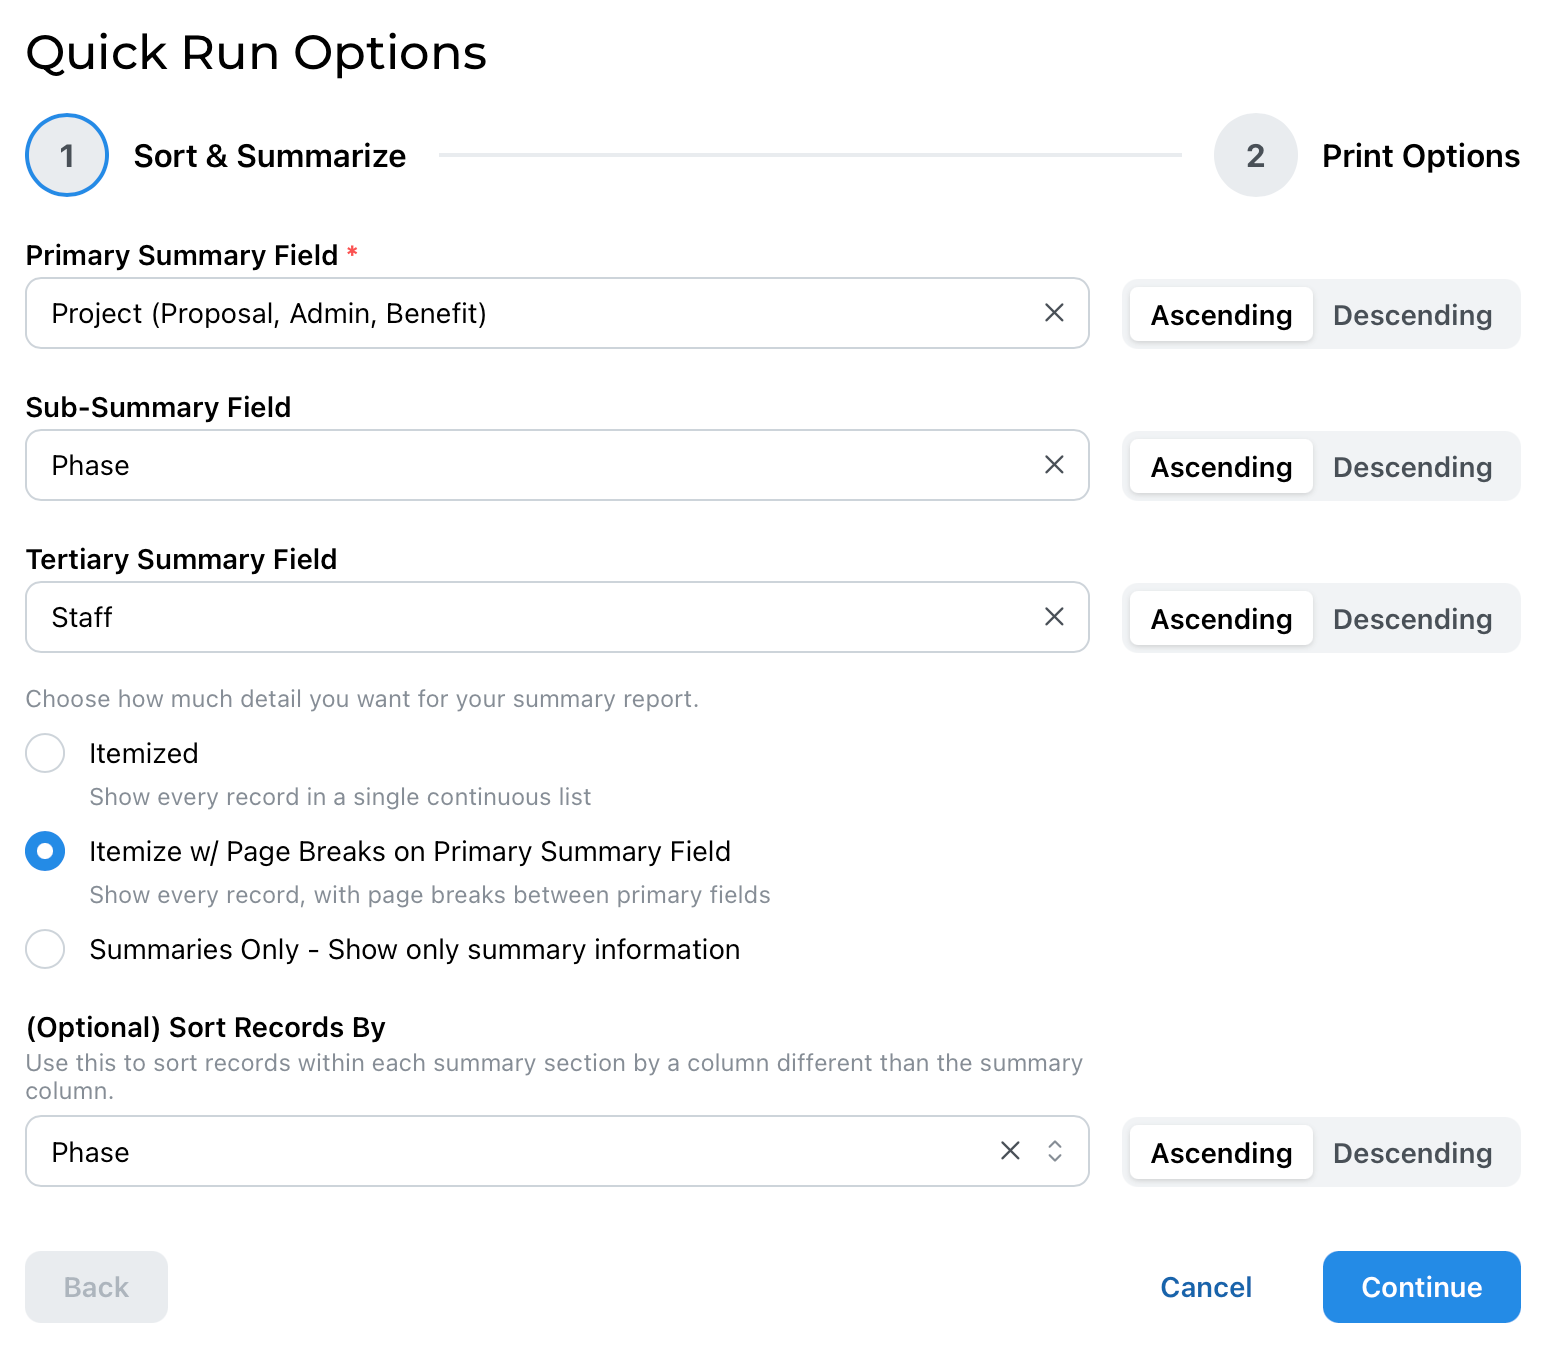
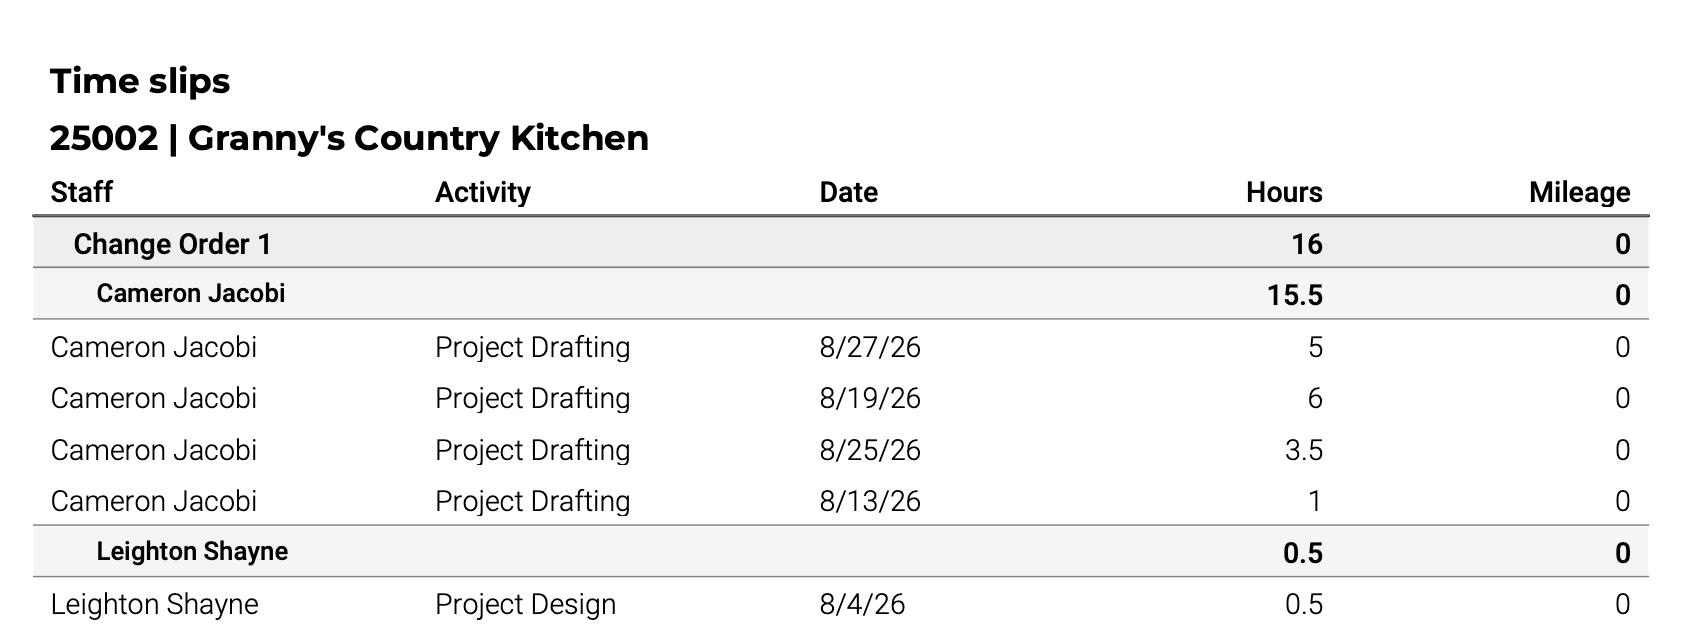
These choices determine how the report actually prints — for example, grouped by project, then by phase, with each staff member's time slips itemized underneath.
Running a Report
After performing your query and selecting your column set, select the Σ (sigma) icon at the top of a list view to open the reports popup for that module.
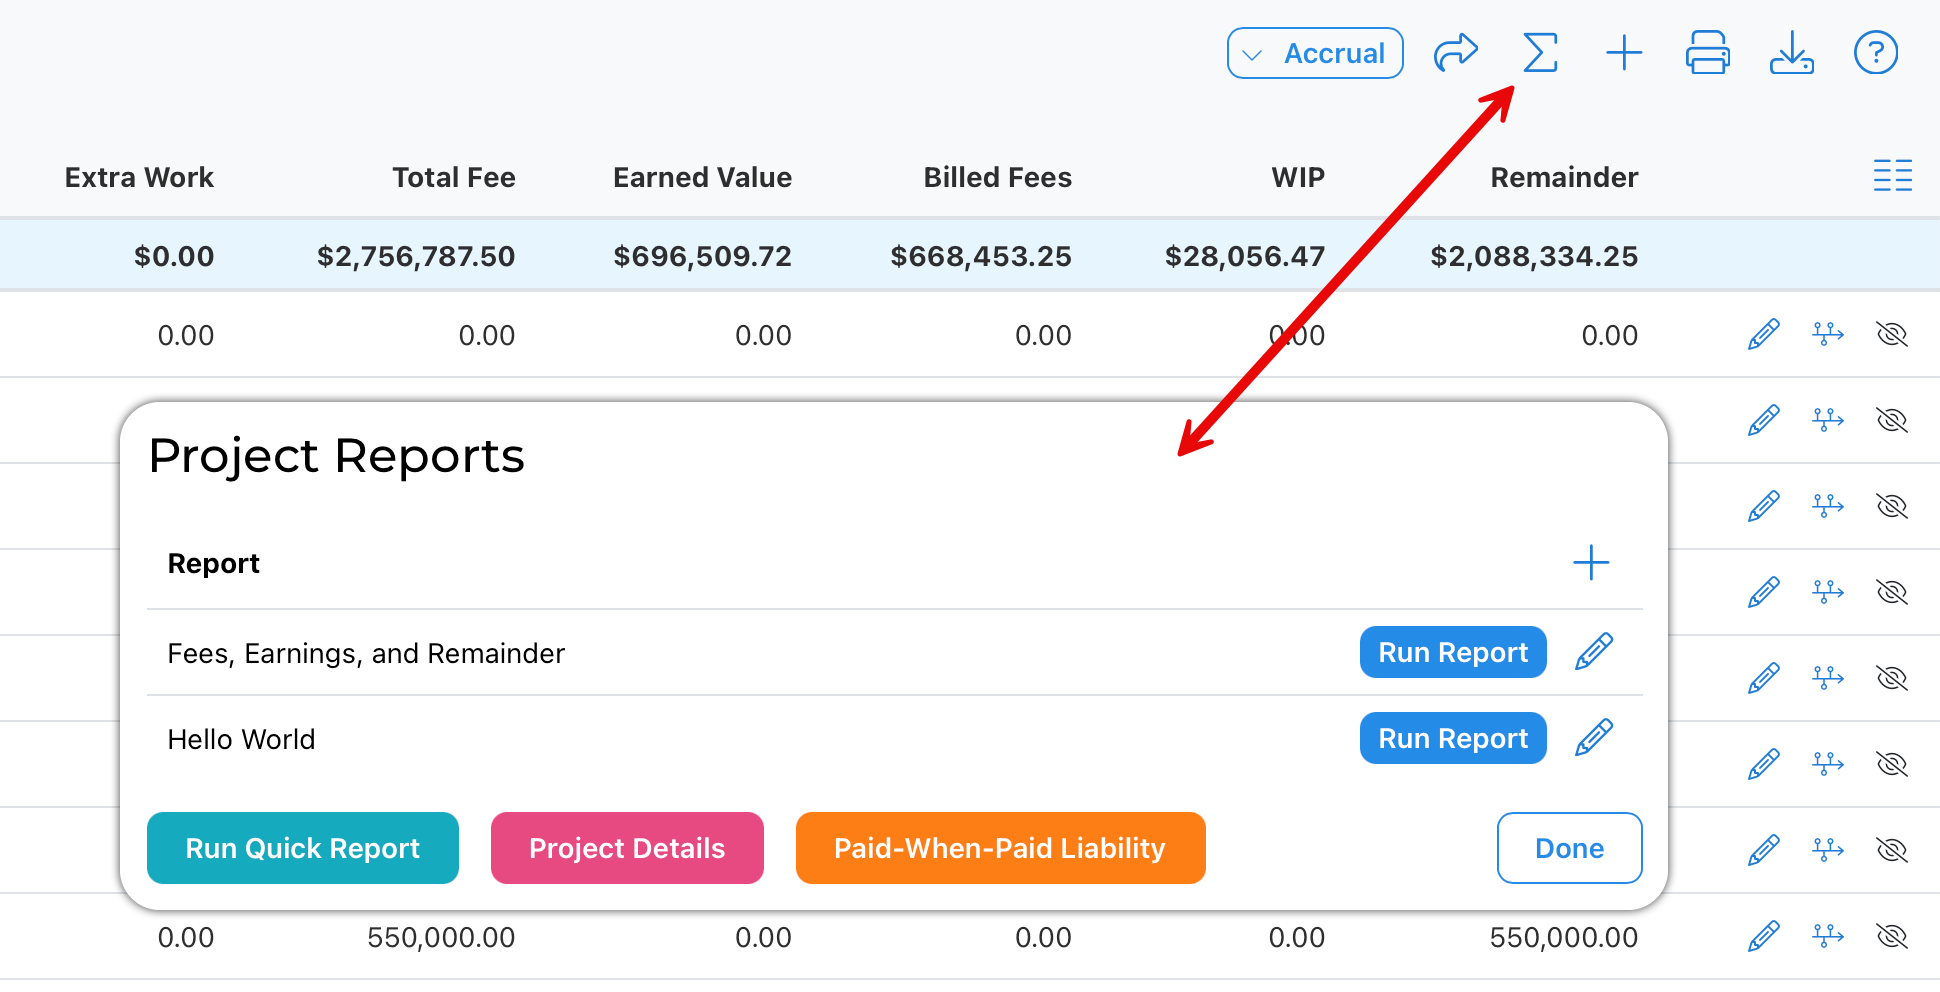
From here you have several options:
- Saved reports — any reports you've previously saved appear in a list (for example, "Fees, Earnings, and Remainder"), each with its own Run Report button and an edit (pencil) icon to modify it.
- Add (+) — create a new report saved report using saved queries and column sets.
- Run Quick Report — run a report using the current found set of records and the current column set.
- System reports — some modules have special system reports that appear as additional buttons along the bottom. For Projects, these include Project Details, and Paid-When-Paid Liability. Other modules will show their own relevant system reports here.
- Done — closes the popup.
Selecting Run Report on a saved report runs it immediately using its built-in query and column set — no need to reconfigure anything.
Saved Reports
Once you've configured a report the way you want it, you can save it. A saved report stores its query and column set together, so running it again is as simple as selecting the blue Run Report button — no need to rebuild the query or reselect a column set each time.
The Reports Dashboard
Saved reports across all modules are accessible from the Reports Dashboard, where they're grouped by module. Reports you star as favorites appear at the top of your dashboard. Favorites are personal to each user — your favorited reports won't affect what another user sees.
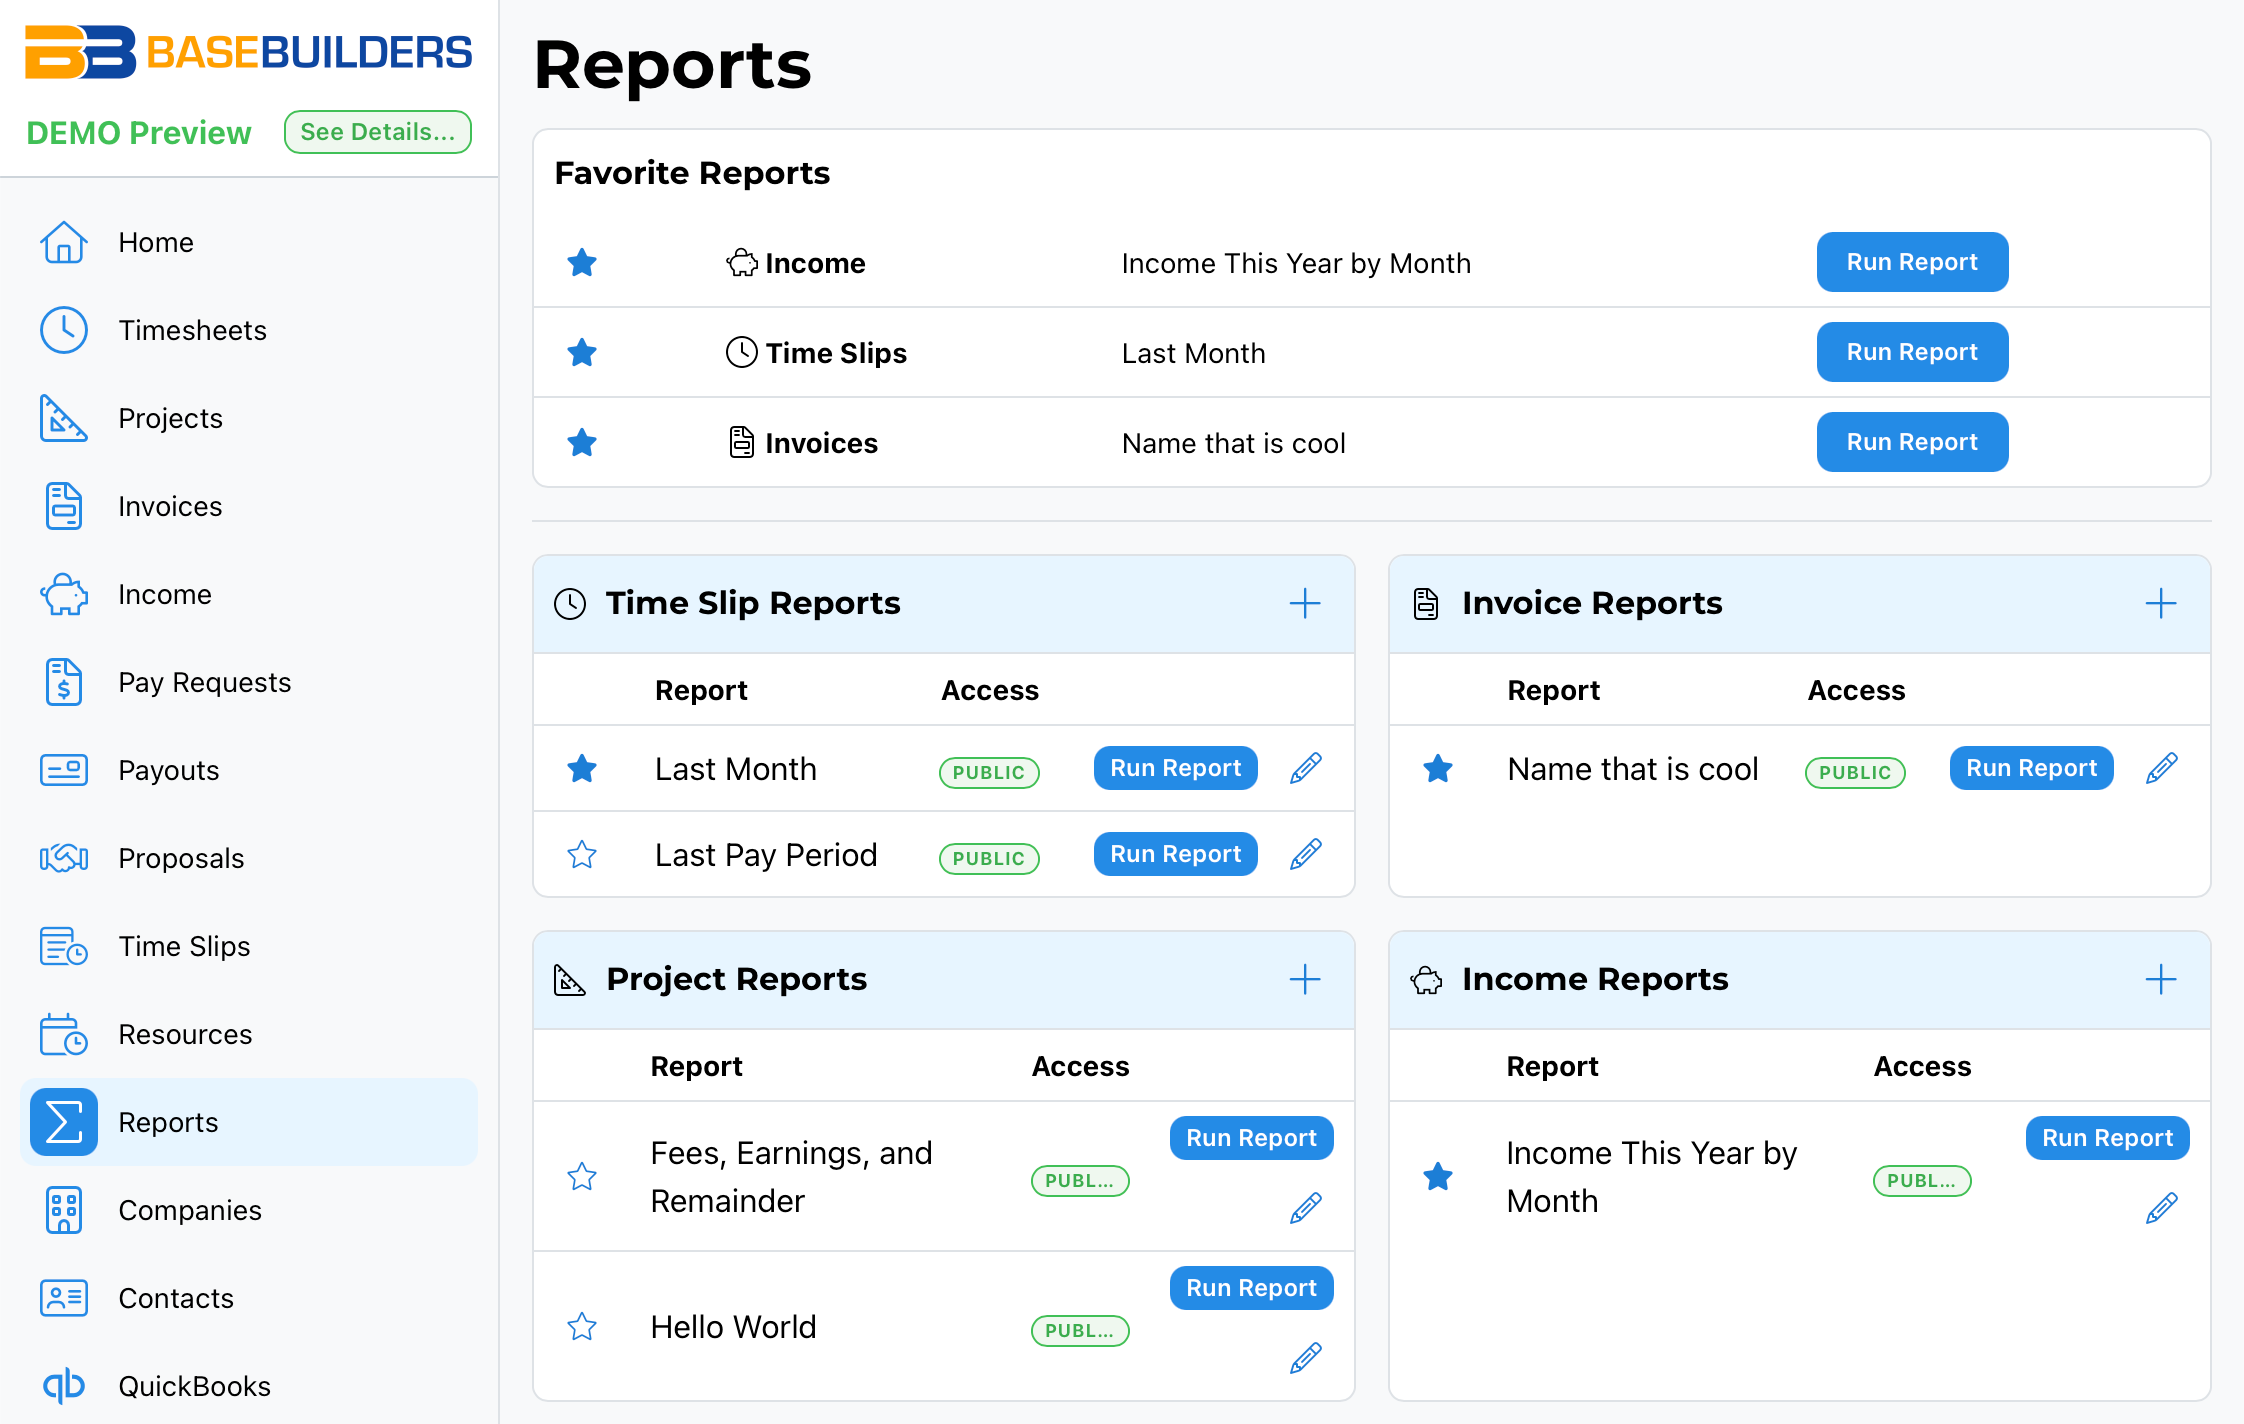
Which reports appear on your dashboard also depends on your access level. For example, Invoice, Income, Pay Request, Payout, and Proposal reports are only available to Financial-level users, so not every user will see every report widget.
Best Practice
Save reports you run regularly rather than rebuilding the query and column set each time — this is what makes the Reports Dashboard genuinely useful day to day. Star your most-used reports as favorites so they surface at the top of your dashboard immediately.
Summary
Reporting in BaseBuilders follows three steps: select records via a query, select data fields via a column set, and configure how results are grouped and summarized (primary/secondary/tertiary sort, itemized or summarized). Reports can be run ad hoc via the Report button, or saved with their query and column set built in for one-click reuse. Saved reports appear on the Reports Dashboard, grouped by module, with user-specific favorites at the top and visibility determined by access level.